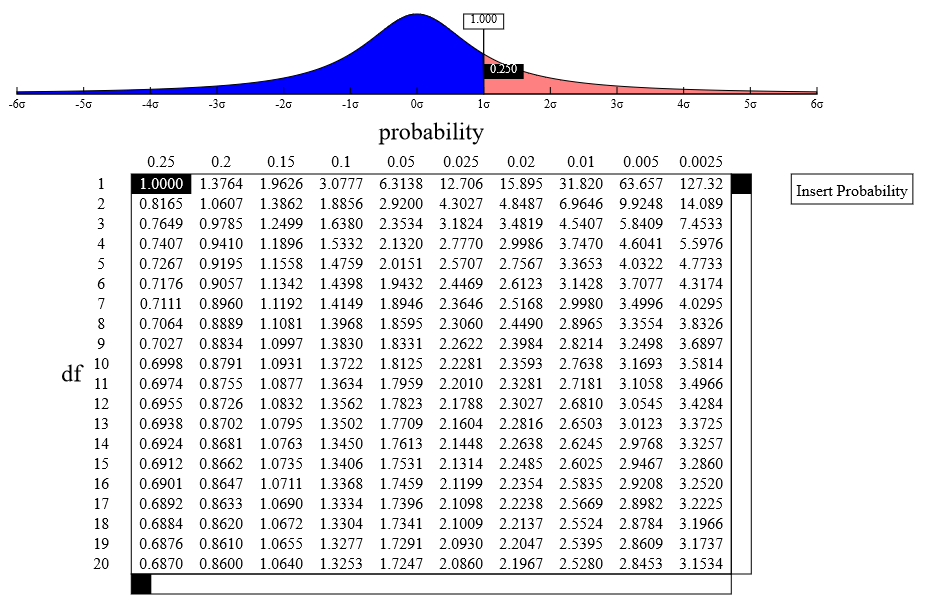
This is an interactive Student’s t probability table. It works just like those found in the back of most statistics textbooks, except that the graph at the top of the page changes to show the shape of the distribution (varying by degrees of freedom) and to show the selected area under the curve, and the table extends to 1,000 degrees of freedom.
You can also drag flag in the graph to any point you like and see the corresponding values in the table at the df currently selected in the table.
Paper t-tables are ordinarily reported only for selected probabilities, but by clicking the Insert Probability button, you can add a column for any probability value you like.