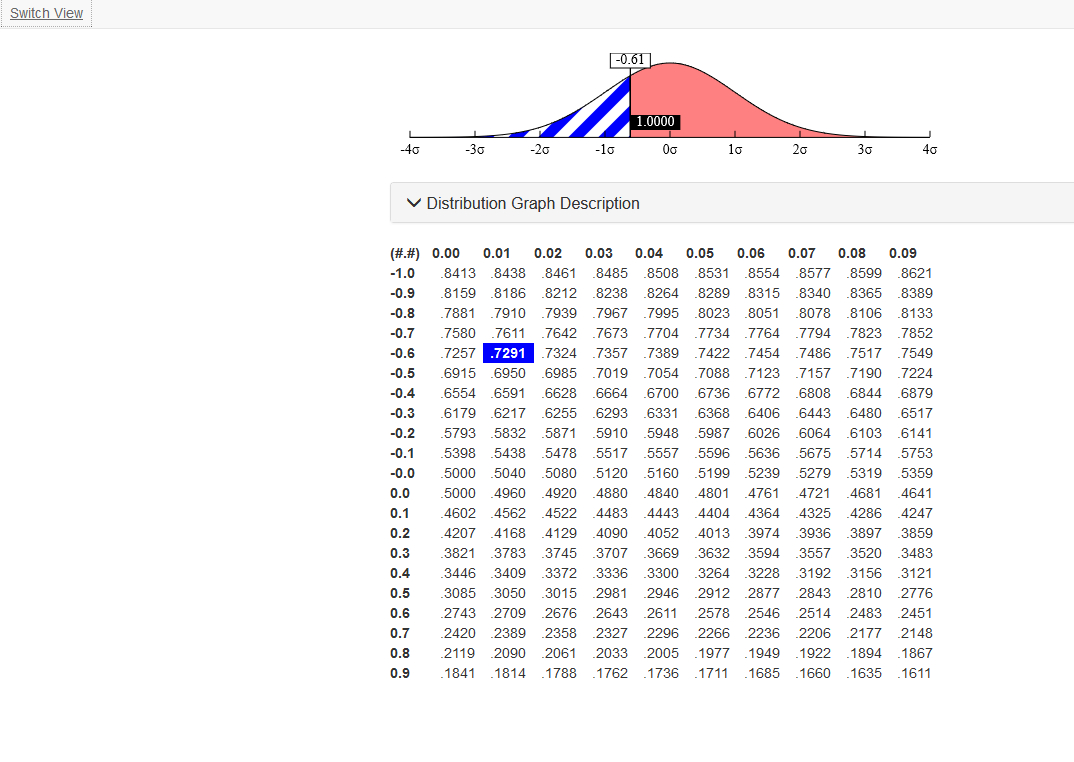
This is an interactive Normal probability table. It works just like those found in the back of most statistics textbooks, except that the graph at the top of the page changes to show the selected area under the Normal curve.
You can also drag flag in the graph to any point you like and see the corresponding values in the table.
If you prefer a direct interface, click the Switch View command and type the z-score or probability into the box provided. The graph is still interactive here.