This is a simulation that demonstrates the Law of Large numbers. Click on the striped bar to see a cursor speed across the bar. Release your mouse button to stop the cursor. The color over which it stops appears in the circle to the right and falls into the appropriate bin for its color. The graph at the bottom shows the accumulated percentage of red balls. Notice that the percentage settles down with more and more results as the Law of Large Numbers says it should. Because the selection is under your control, you can be assured that the results are truly random and not pre-determined or even “pseudo-random”.
To accelerate the process, drag the slider to specify a “batch” size and click the Sample button to run the simulation many times.
Note that the “population” proportion of red (the fraction of the bar that actually is red) is randomly determined, so the value to which the experimental results converge is different each time you use the tool. Click the Reset button to make a new colored bar (with a different true percentage of red).
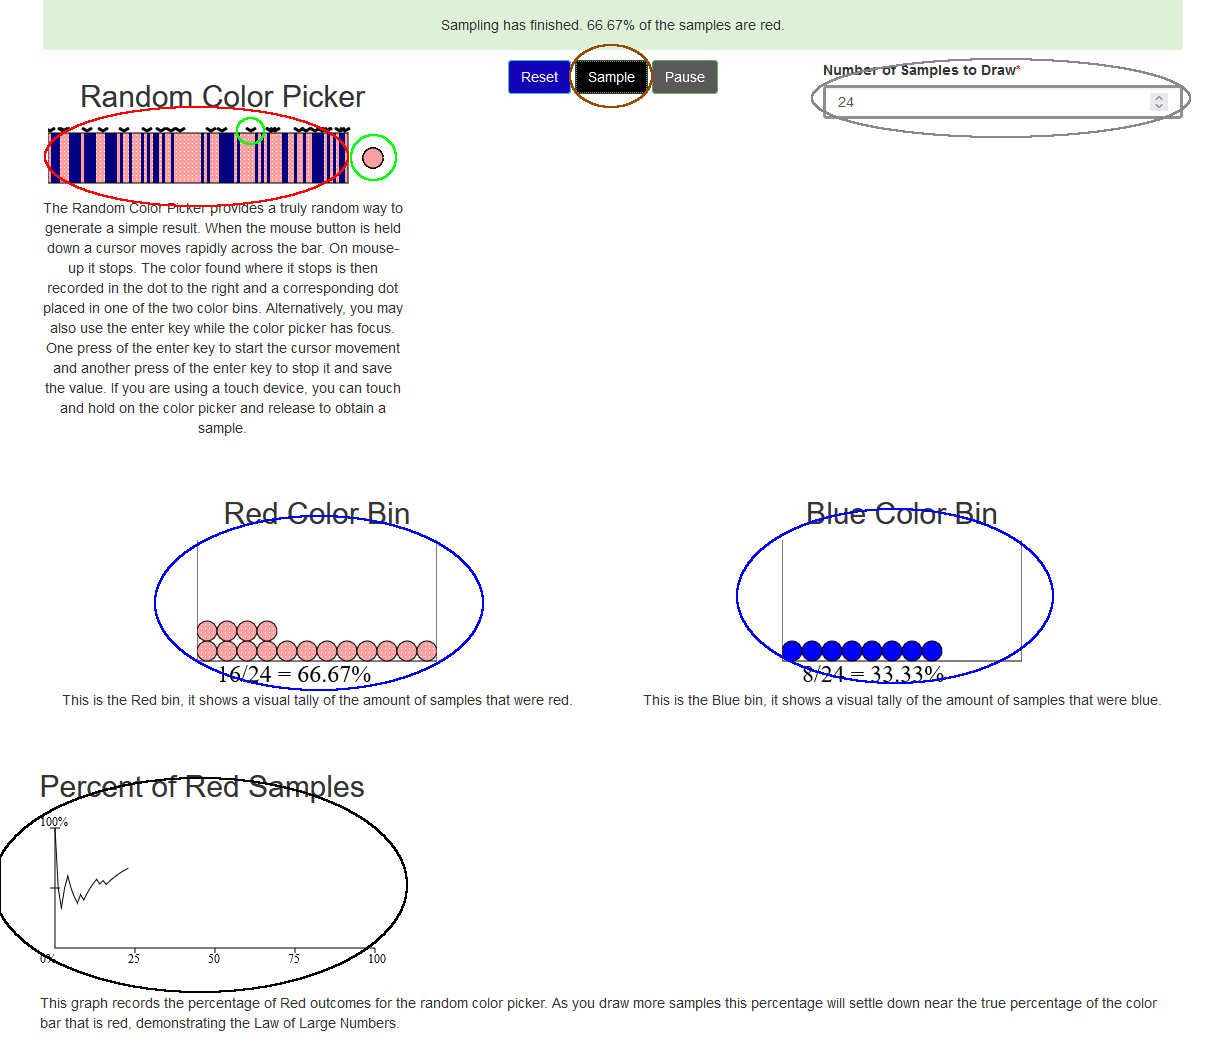
- Mouse down on the striped bar (circled in Red)
- On Mouse up the cursor will stop and the ball will take the color of the selected stripe (circled in Green)
- Balls accumulate in their respective bins (circled in Blue)
- Graph shows %Red (circled in Black)
- To save effort, slide the Batch Size (circled in Gray), and
- Click Sample (circled in Brown)