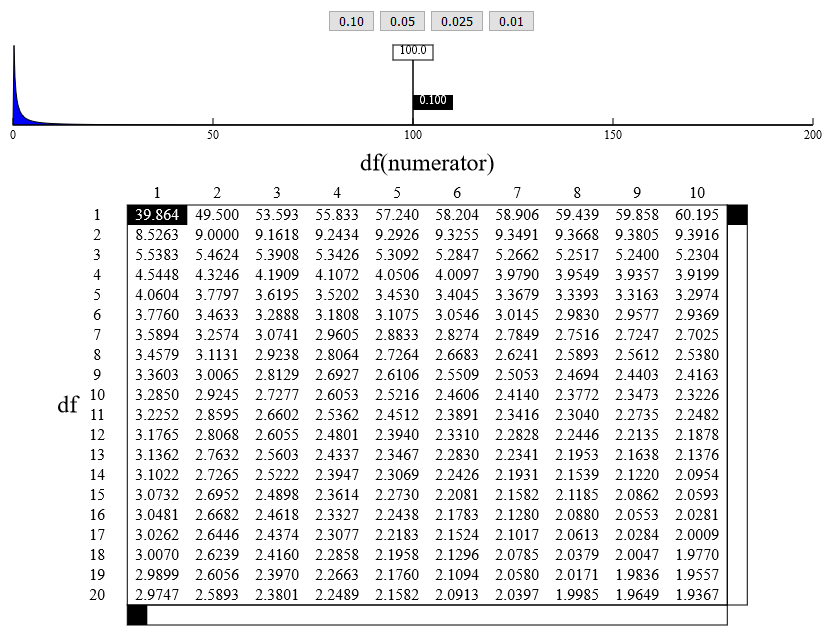
This is an interactive F probability table. It works just like those found in the back of most statistics textbooks, except that the graph at the top of the page changes to show the selected area under the curve and to show the shape of the curve as it corresponds to the degrees of freedom. And the table extends to 120 and 120 df.
You can also drag flag in the graph to any point you like and see the corresponding values in the table at the df currently selected in the table.