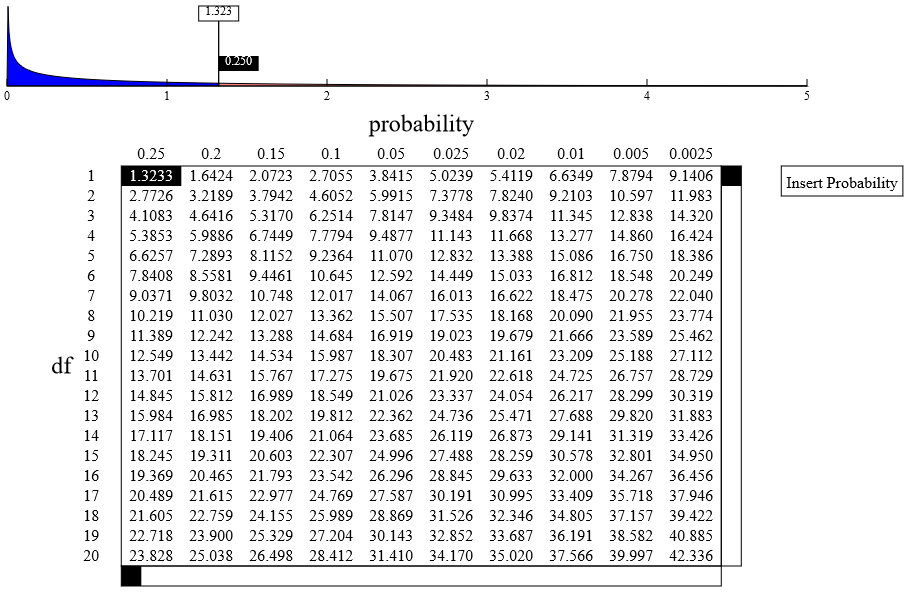
This is an interactive Chi square probability table. It works just like those found in the back of most statistics textbooks, except that the graph at the top of the page changes to show the selected area under the curve and to show the shape of the curve as it corresponds to the degrees of freedom. And the table extends to 200 df. You can also drag flag in the graph to any point you like and see the corresponding values in the table at the df currently selected in the table.
Paper Chi Square tables are ordinarily reported only for selected probabilities, but by clicking the Insert Probability button, you can add a column for any probability value you like.
The Chi square distribution changes radically from 1 df to more df. Try clicking at the top of a column and dragging down the table while watching the graph of the distribution. Chi square becomes more nearly Normal, and its mean slides to higher values with higher df. In fact, the mean of the chi square is the number of df. (The mode is at df – 1.) Above 200 df, use the fact that as the df, k, approaches infinity Chi square on k df approaches the Normal with mean k and standard deviation sqrt(2k).