This tool demonstrates the Central Limit Theorem. In operation, it works much like the Random Quantitative Generator tool (which you might want to look at first.) Click on the blue bar to start the cursor. Release the mouse button to stop the cursor. The cursor runs at a constant speed between 0 and 1. The value at which it stops is shown to the right and falls into the collection bin. Now set your sample size, n, between 1 and 36 with the slider. The tool will draw that many values at random, placing them in the bin on the right. It will then find the mean of these values and add it to the histogram at the bottom of the window. To speed things up, select a Batch size with the second slider. The tool will then repeat the experiment that many times, accumulating a histogram of the sample means. If the maximum of 300 samples isn’t enough, click the Sample button several times to add to your sample of means.
Notice that the histogram tends to be unimodal and symmetric and to resemble a Normal model. Experiment with the sample size to see how that affect the shape and spread of the histogram.
Now select a different underlying shape for the data from the list of alternatives. Physically, what happens is that the speed of the cursor adjusts to the height of the population distribution so that values are drawn at random from that population.
How does the tendency for the means to follow a Normal model depend on the sample size for different population distributions?
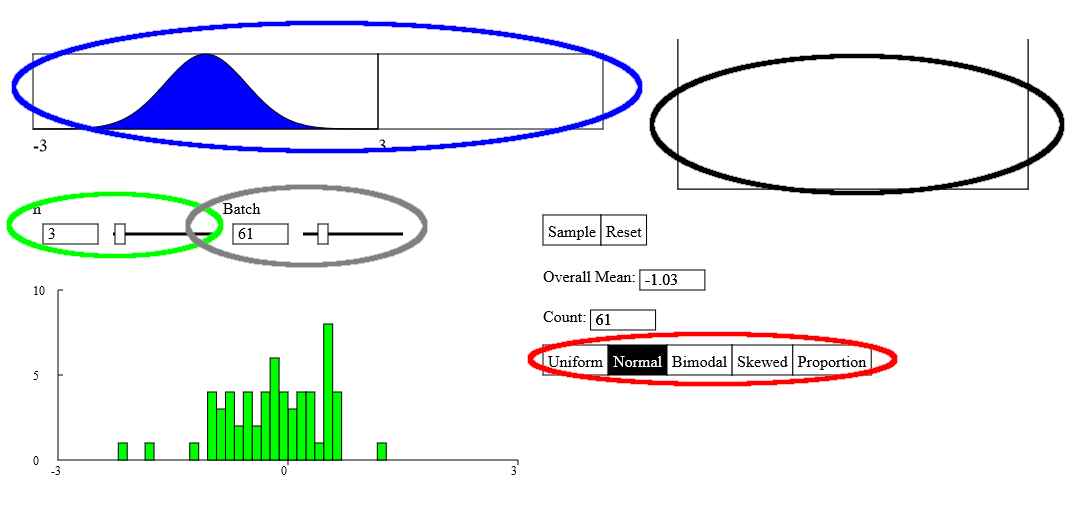
- Select a population distribution (circled in Red)
- Set a sample size (circled in Green)
- Mouse down on the blue graph (circled in Blue)
- On Mouse up, the cursor stops along the bar and a sample of the specified size is draws from the population, and appears in the bin on the right (circled in Black). The mean of the sample is added to the histogram
- Set your batch size and click Sample to automate the process. (circled in Gray)