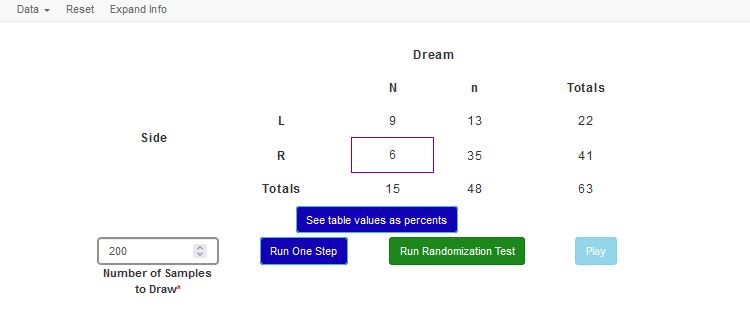
Take two variables, one binary variable X and one binary Y. For example, sex and handedness.
Record the count in the bottom left cell.
Assign the set of Y variables to the set of X variables randomly, and record the new value of the bottom left cell.
By plotting many random cases, we can compare our result to a distribution of null cases

